
8 • PANDORA IN 2016
PANDORA ANNUAL REPORT 2016
Capital expenditure was DKK 1,199 million compared with
DKK 1,109 million in 2015. As in 2015, the level of CAPEX
continued to be impacted by the development of our
crafting facilities in Thailand, investments in our distribution
network, and IT investments.
PANDORA’s tax rate for 2016 was 21.2%, which was in
line with expectations.
DIVIDEND AND SHARE BUYBACK PROGRAMME
For the financial year 2015, PANDORA paid out ordinary
dividend of DKK 13 per share, corresponding to DKK
1.5 billion in total. From 2017, PANDORA proposes to
supplement the ordinary dividend with three extraordinary
quarterly dividends.
Following a strong financial performance in 2016, the Board
of Directors proposes to return DKK 4.0 billion in dividend in
2017. This includes an ordinary dividend of DKK 9 per share
and additionally three extraordinary quarterly dividends of DKK
9 per share in relation to Q1 2017, Q2 2017 and Q3 2017. In
total, PANDORA will pay out a total of DKK 36 per share in
2017.
Furthermore, the Board of Directors of PANDORA has
decided to launch a new share buyback programme in
2017, under which PANDORA expects to buy back own
shares to a maximum consideration of DKK 1.8 billion.
The shares acquired within the programme will be used to
reduce PANDORA’s share capital and to meet obligations
arising from employee share option programmes. The share
buyback programme will run in the period from 7 February
2017 to no later than 6 February 2018.
FINANCIAL PERFORMANCE
PANDORA generated revenue of DKK 20.3 billion in 2016.
This was aided by strong double-digit growth in all four
quarters and, in total, revenue increased by 21% compared
with 2015. This was in line with the renewed guidance
that we communicated in May based on a very strong
performance in the first quarter.
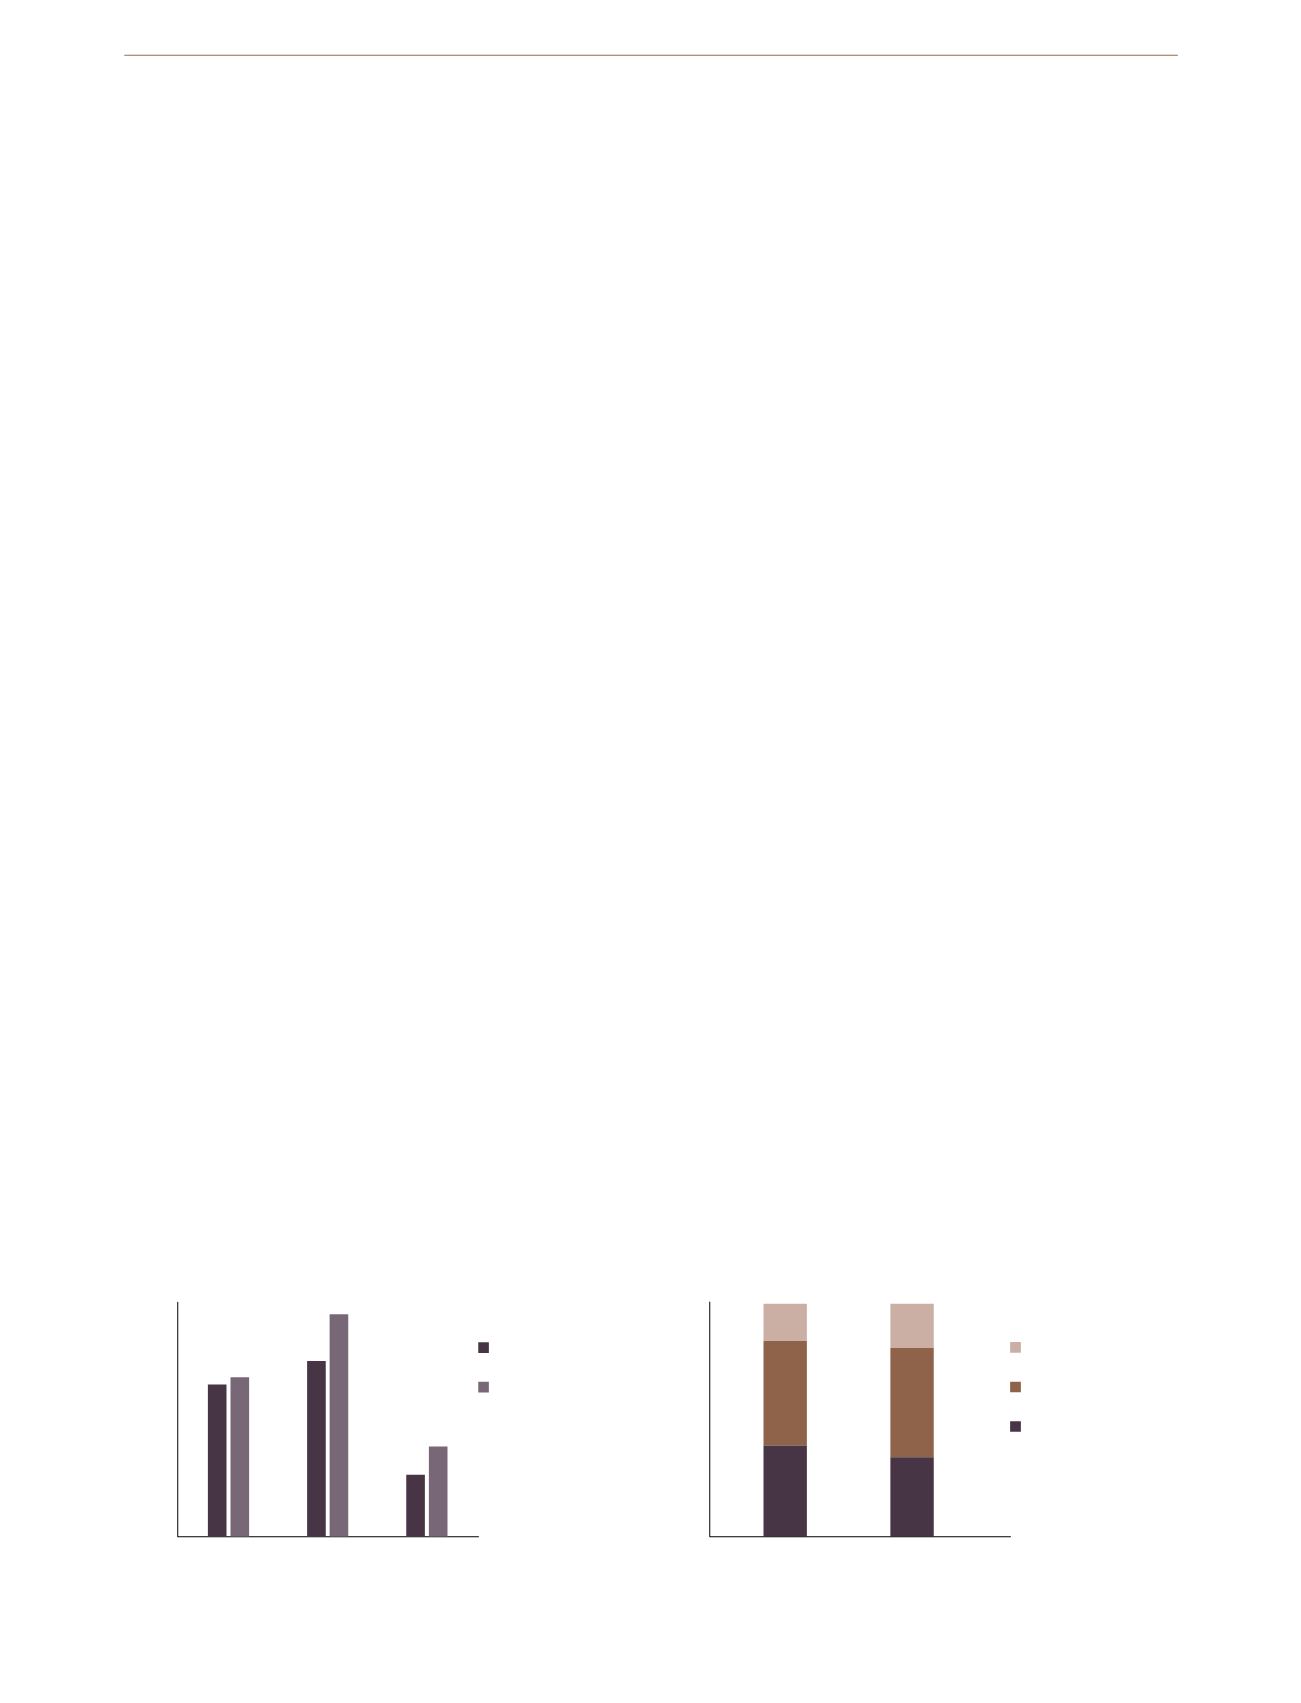
Revenue growth was driven by good performance
across all geographical regions. The Americas increased
revenue by 5%, EMEA by 27% and Asia Pacific by 46%. In
addition, revenue from all product categories experienced
positive growth, driven by new as well as existing products.
Around half of our revenue growth in 2016 can be
attributed to the expansion of our store network, which
included the addition of net 336 new concept stores in
2016. Together with the closing of multibranded stores, this
gave us a stronger and much more branded store network
compared with the beginning of the year.
The level of EBITDA margin exceeded initial
expectations for the year. Earnings before interest, tax,
depreciation and amortisation (EBITDA) was DKK 7.9
billion in 2016, corresponding to an increase of 27%
compared with 2015. Our EBITDA margin for the year was
39.1% compared with 37.1% in 2015.
The improvement of our EBITDA margin was primarily
related to lower realised commodity prices compared with
2015, as well as increasing leverage on costs in our more
developed markets. However, some of the increase was
offset by greater complexity of production as well as our
geographical expansion, primarily in Asia.
REGIONAL REVENUE
REGIONAL REVENUE SHARE
100
80
60
40
20
0
%
2016
2015
Asia Pacific
EMEA
Americas
34%
47%
19%
39%
45%
16%
DKKm
2015
2016
Asia Pacific
EMEA
Americas
0
2,000
4,000
6,000
8,000
10,000


