


 6 / 143

FINANCIAL HIGHLIGHTS
DKK million
2016
2015
2014
2013
2012
Consolidated income statement
Revenue
20,281 16,737 11,942
9,010
6,652
Gross profit
15,223 12,193
8,423 5,999
4,429
Earnings before interest, tax, depreciation and amortisation (EBITDA)
7,922 6,214 4,294 2,881
1,658
Operating profit (EBIT)
7,404 5,814 4,072
2,681
1,475
Net financials
246
-469
-200
61
4
Net profit for the year
6,025 3,674 3,098
2,220
1,202
Consolidated balance sheet
Total assets
15,085 13,311 10,556
9,275
8,414
Invested capital
9,396 8,255 6,080 5,976
5,900
Operating working capital
2,780 2,388 1,990 1,846 2,039
Net interest-bearing debt (NIBD)
1
2,448 1,921 -1,121
-637
-183
Equity
6,794 6,139 7,032
6,462
6,038
Consolidated cash flow statement
Net increase/decrease in cash
5
-245
431
361
165
Free cash flow
5,358 2,449 3,868
1,956
1,151
Cash conversion, %
72.4% 42.1% 95.0% 73.0% 78.0%
Growth ratios
Revenue growth, %
21% 40% 33% 35% 0%
Gross profit growth, %
25% 45% 40% 35% -9%
EBITDA growth, %
27% 45% 49% 74% -27%
EBIT growth, %
27% 43% 52% 82% -28%
Net profit growth, %
64% 19% 40% 85% -41%
Margins
Gross margin, %
75.1% 72.9% 70.5% 66.6% 66.6%
EBITDA margin, %
39.1% 37.1% 36.0% 32.0% 24.9%
EBIT margin, %
36.5% 34.7% 34.1% 29.8% 22.2%
Other ratios
Effective tax rate, %
21.2% 31.3% 20.0% 19.0% 18.7%
Equity ratio, %
45.0% 46.1% 66.6% 69.7% 71.8%
NIBD to EBITDA, x
0.3
0.3
-0.3
-0.2
-0.1
Return on invested capital (ROIC), %
78.8% 70.4% 67.0% 44.9% 25.0%
Share information
Dividend per share
2
, DKK
9.00 13.00
9.00
6.50
5.50
Total payout ratio (incl. share buyback), %
91.5% 135.8% 104.1%
63.7%
59.5%
Earnings per share, basic, DKK
52.8
30.9
25.0
17.2
9.2
Earnings per share, diluted, DKK
52.5
30.7
24.7
17.0
9.2
Share price at year-end, DKK
924.0 872.0 504.5 294.0
124.5
Other key figures
Capital expenditure (CAPEX), DKK million
1,199 1,109
455
490
276
Capital expenditure, tangible assets (CAPEX), DKK million
828
706
297
182
167
Store network, total number of points of sale
8,131 9,271 9,906 10,279 10,374
Store network, total number of concept stores
2,138 1,802 1,410 1,100
895
Average number of full-time employees
17,770 13,971 9,957
6,910
5,753
1
For 2015, NIBD and consequently NIBD to EBITDA were recalculated due to reclassifications. Refer to note 4.3.
2
Dividend proposed per share for 2016.
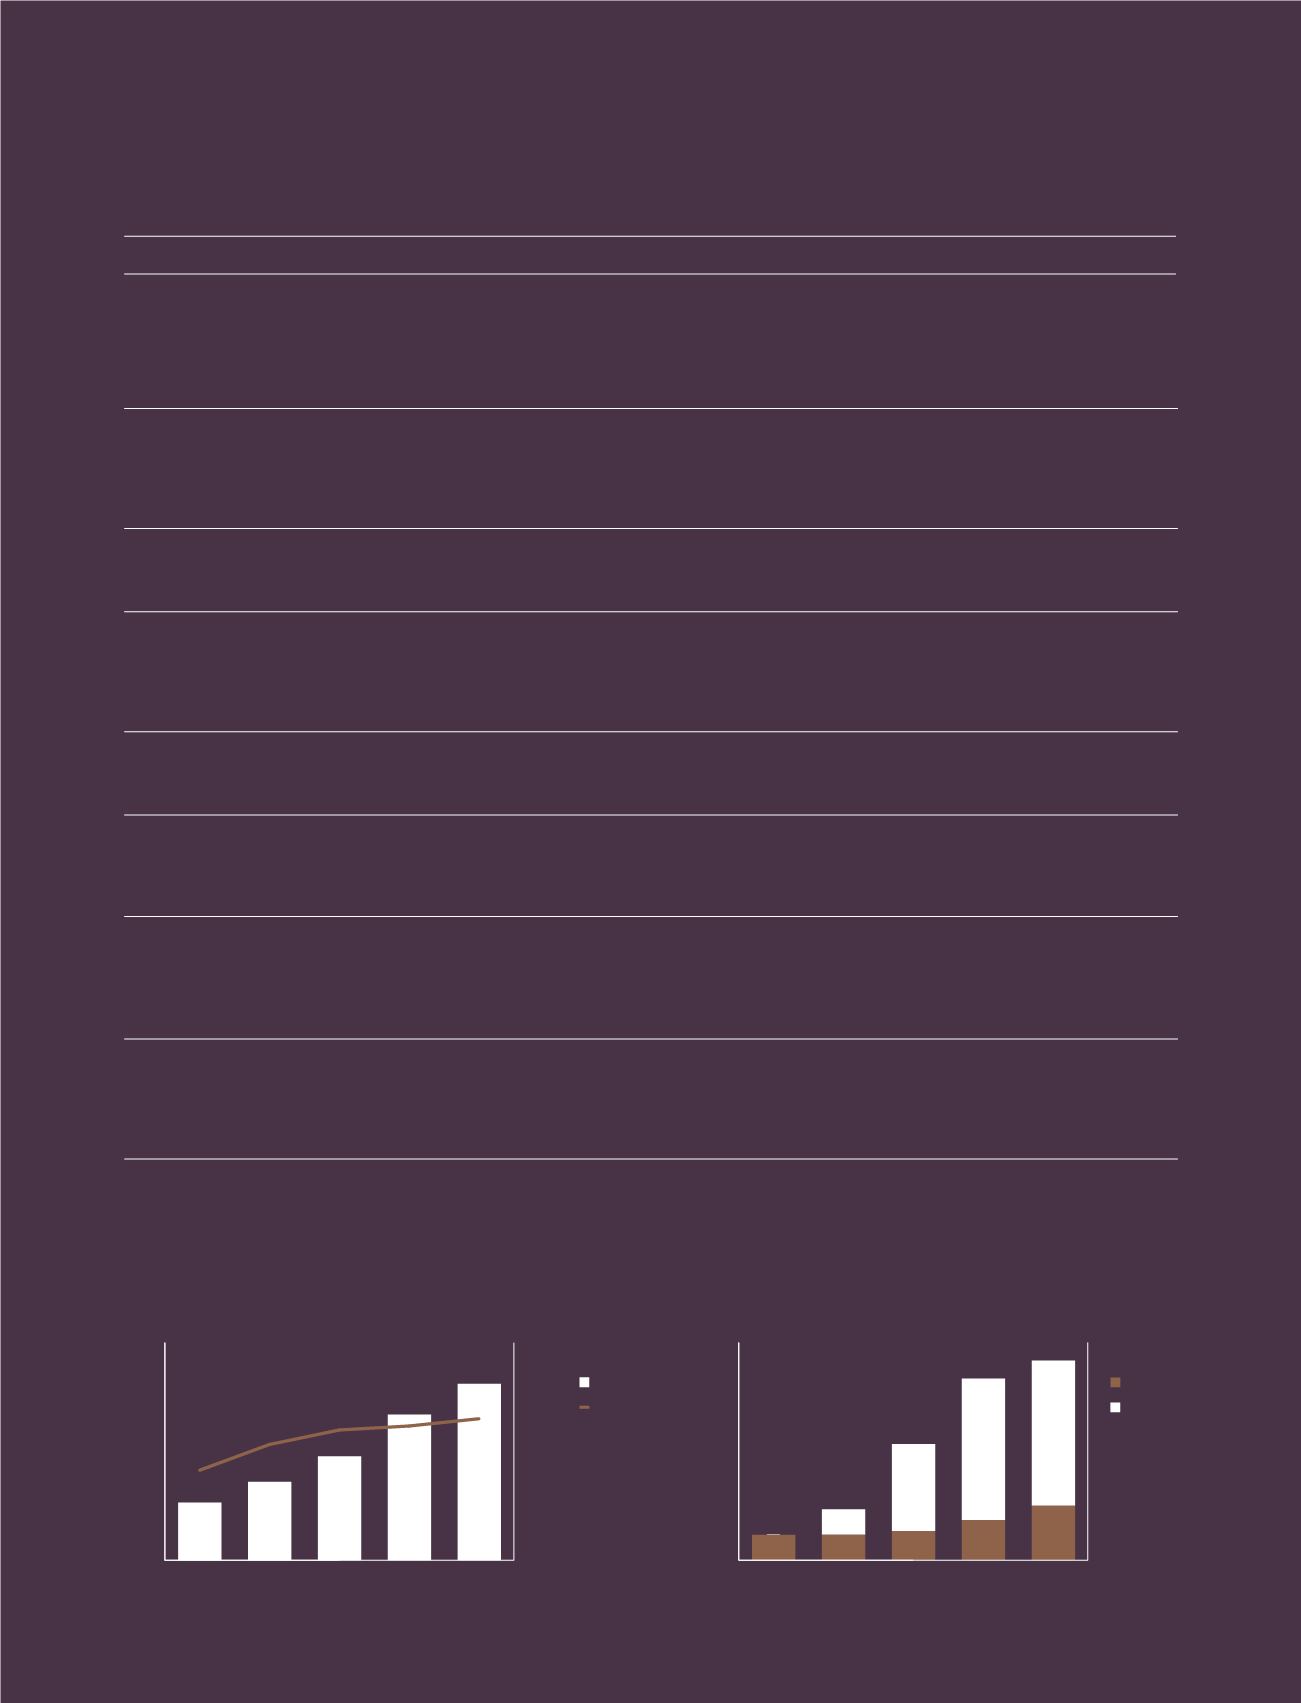
REVENUE AND EBITDA MARGIN
DIVIDEND AND SHARE BUYBACK
0
5,000
10,000
15,000
25,000
20,000
Revenue
0%
20%
40%
60%
DKKm
EBITDA
margin
2016
2015
2014
2013
2012
Share
buyback
Dividend
1.4
0.7
0.7
0.7
0.7
3.2
2.4
0.8
1.1
3.9
4.0
1.5
5.0
5.5
2016
2015
2014
2013
2012
0
2.0
1.0
3.0
5.0
4.0
6.0
DKKbn