


 104 / 143

102 • Consolidated financial statements
PANDORA ANNUAL REPORT 2016
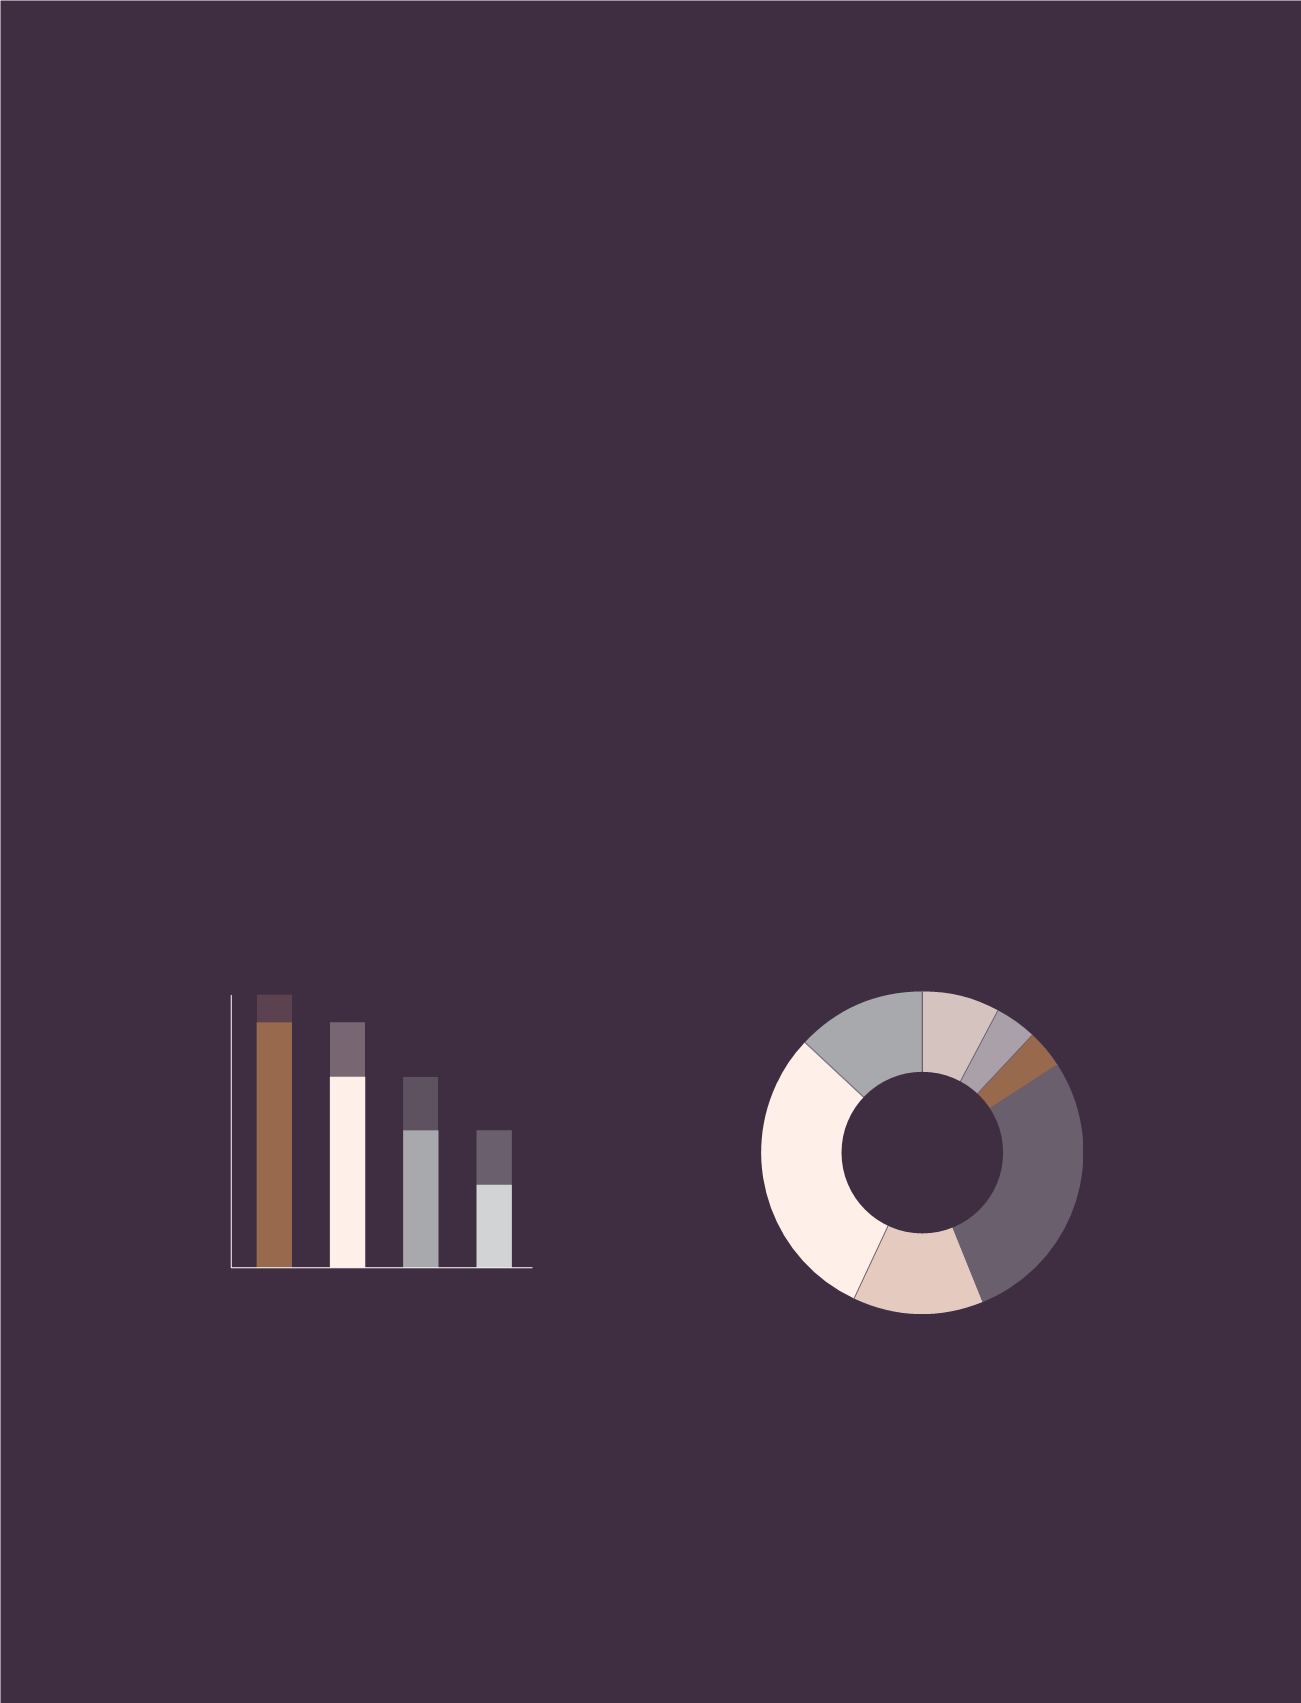
13%
GBP
30%
USD
13%
Other
28%
EUR
4%
CNY
4%
CAD
8%
AUD
1-3 months ahead
4-6 months ahead
7-9 months ahead
10-12 months ahead
100
90
80
70
60
50
40
30
20
10
0
%
90-100%
MIN
.
MAX
.
MIN
.
MAX
.
MIN
.
MAX
.
MIN
.
MAX
.
70-90%
50-70%
30-50%
SECTION 4
CAPITAL STRUCTURE
AND NET FINANCIALS
CASH CONVERSION
TOTAL PAYOUT RATIO
SHARE BUYBACK
4,000
DKK million
72.4%
91.5%
This section includes notes related to PANDORA’s
capital structure and net financials, including financial
risks (see note 4.4). As a consequence of its operations,
investments and financing, PANDORA is exposed to a
number of financial risks that are monitored and man-
aged via PANDORA’s Group Treasury. PANDORA uses
a number of derivative financial instruments to hedge
its exposure to fluctuations in commodity prices and
similar. Derivative financial instruments are described in
note 4.5.
The basis of PANDORA’s capital management is the
NIBD to EBITDA ratio, which Management seeks to
maintain between 0 and 1. At 31 December 2016, the
ratio was 0.3 compared with 0.3 at 31 December 2015.
PANDORA’s ability to keep this low ratio is based on the
high cash conversion. The cash conversion was 72.4% in
2016 compared with 42.1% in 2015.
COMMODITY HEDGE RATIO
REVENUE BREAKDOWN BY CURRENCY